Author: Aj-Tap
Introduction
If you work in security operations, you’re likely familiar with the routine: gathering data from various sources (maybe VirusTotal, Shodan, AbuseIPDB, OTX, internal MISP instances), trying to connect the dots to understand the context around an alert or indicator (“Is this IP really involved in something nasty, or is it just noise?”), determining relevance, and then using that knowledge to inform blocking rules, detection signatures, or threat hunts.The sheer volume and variety of available TI sources, while valuable, often create practical hurdles. Analysts can find themselves juggling numerous browser tabs, manually pivoting between different tools for the same indicator, and struggling to correlate findings across platforms that use different formats and scoring methods. This manual effort consumes significant time and increases the risk of missing critical connections hidden within the data flood.
I’ve been encountering this problem during my SOC, there are already a bunch of tools in the market made by the community. Instead of creating a completely new solution, the focus should be on unifying this information, processing it efficiently, and enabling thorough investigation across diverse threat intelligence and open-source intelligence (OSINT) data.
Instead of building something completely new, the goal is to create a tool that brings together and cleans up all this threat intelligence and open-source information so investigations are easier. I’m thinking of something that’s as easy to use as SpiderFoot and IntelOwl for getting data, but also has Maltego’s graph view and a simple table view without complicated setups. Ideally, it would also include detection rules set, an Agent LLM for analysis, and maintain a simple, SOC-workflow-friendly design (KISS principle). The goal is to make life easier for security folks dealing with threat data, cut down research time, and help them make faster, better decisions to speed up response times.
This need is what led to Huntsman, a tool that helps speed up and simplify investigations by putting all the threat intelligence data in one place, making it easy to understand, and offering strong search and detection features.
Centralizing Chaos: How Huntsman work
Huntsman is a Threat Intelligence Aggregator tool specifically designed to support and accelerate SOC workflows. It streamlines the investigations and pivoting process, enabling analysts to quickly collect data and pivot through related IOCs. Instead of manually pivoting to numerous external websites and threat intelligence feeds for enrichment, Hunt acts as a central analysis hub. When you submit an indicator, It triggers configured Analyzers (e.g., VirusTotal, Shodan, ThreatFox, etc..) via playbook-defined tasks. These tasks are managed in the background by Celery workers, with Redis monitoring their status. Completed results are stored in a data lake. Afterward, regular expressions process the report data to extract objects and produce a STIX-formatted output.
The data lake is powered by Superdb, which allows to store raw JSON results without requiring a predefined schema.This aggregated data, residing in a data lake, can then serve as context for Large Language Models (LLMs) to generate summaries and conduct further analysis.
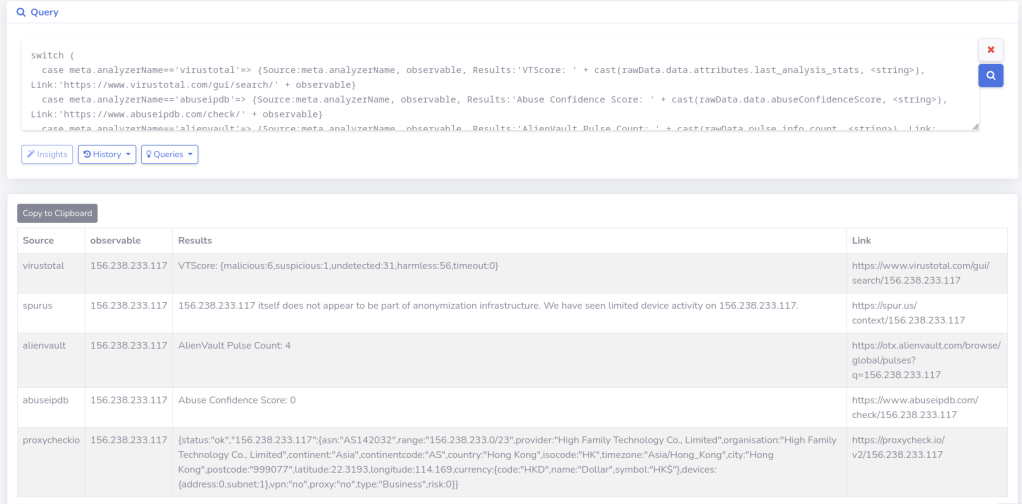
Submitting an Indicator
Below is a sample workflow for submitting an observable to insights. Imagine you’ve found an indicator (IPv4) in event logs. Here is a video exploring this in Huntsman.
Huntsman uses various threat intelligence feeds and an AI agent to analyze data and offer summarized insights. Analysts can also examine the raw data and perform deeper investigations through IOC pivoting.
Imagine having to check each source individually. The downloading of results and cleaning the data would require a tool like Excel or Notepad to compare the information with other sources. Juggling multiple tabs while under a strict SLA for MTTR makes time critical. Plus, you’d have to read each source manually, which is repetitive.
Based on the VirusTotal (VT) score from Huntsman’s results, the observed sample has a low confidence score of 6/64. Consider an analyst investigating an inbound connection from this IP in event logs and relying solely on VT. This low score could be misleading, causing them to miss actual malicious indicators and potentially close a critical alert.
Under the Hood: Scalable Backend Processing
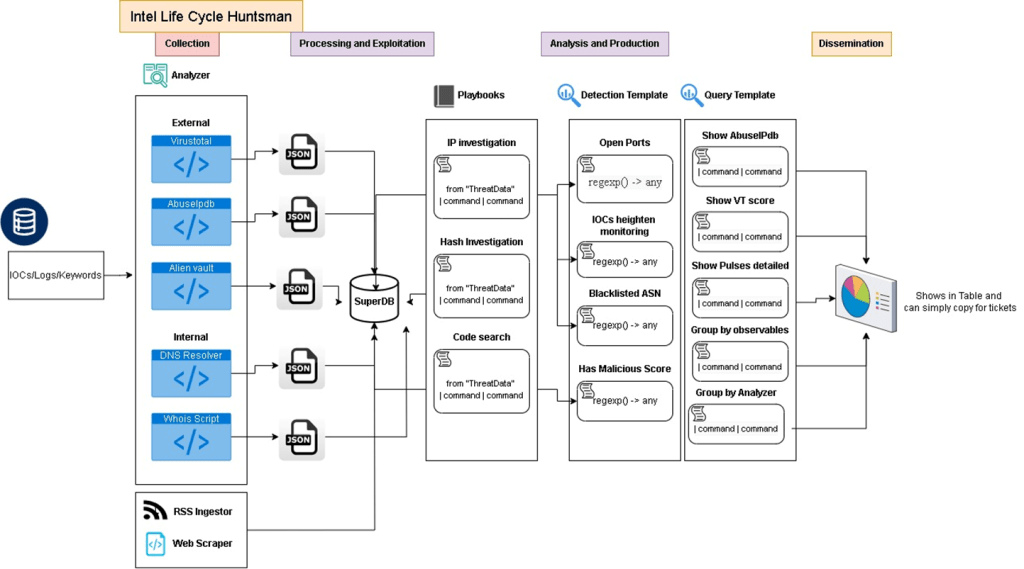
High-level Architecture of Huntsman Version 1
Using this tool, you can gather data from various threat intelligence providers and pivot through Indicators of Compromise (IOCs) to discover a network of related indicators, as well as compare the results.
Key Platform Concepts
- Indicator: The observable submitted for analysis (IP, Domain, URL, Hash, etc.), often originating from an alert, log, or threat feed. The platform maintains a structured record for each submitted indicator.
- Analyzer: An integrated module that connects to a specific external tool/API (e.g., VirusTotal, Shodan) or performs a local analysis function. These are the building blocks for data enrichment. Analyzer configurations (API keys, enable/disable) are typically managed by administrators.
- Task: Represents a single analysis job for an indicator, managing the execution of relevant Analyzers. Includes status tracking (Pending, Running, Completed, Failed) visible to the analyst.
- Result: Stores the structured data returned by a specific Analyzer for a given Task. All results for a task are aggregated for analyst review.
- Rule: A user-defined condition based on analysis results (e.g., “VirusTotal detections > 5” or “Shodan tag contains ‘Cobalt Strike JARM hash’”). Rules support custom detection logic and workflow automation.
Threat Intelligence Sources (Analyzers)
Huntsman leverages numerous Analyzers to gather diverse intelligence valuable for SOC analysis:
- VirusTotal: Crucial for checking file, URL, domain, and IP reputation against AV engines and blocklists.
- Shodan: Identifies external exposure, open ports, service banners, and device vulnerabilities – key for assessing target infrastructure.
- AbuseIPDB: Provides IP reputation based on community reports of malicious activity (spam, attacks).
- ThreatFox: Supplies IOCs specifically linked to known malware families, aiding malware analysis.
- URLHaus: Tracks URLs actively distributing malware, useful for phishing and malware delivery investigations.
- MalwareBazaar: Provides malware samples and associated IOCs for deeper malware analysis context.
- AlienVault OTX: Accesses community-sourced threat intelligence pulses (IOCs, TTPs).
- MISP: Integrates with MISP instances for structured threat intelligence sharing.
- WHOIS: Retrieves domain/IP registration details for infrastructure ownership analysis.
- DNS Resolver: Performs DNS lookups and gathers passive DNS history, essential for mapping related domains/IPs.
- Certificate Search: Finds related infrastructure by searching public SSL/TLS certificate logs.
- URLScan.io: Analyzes website behavior, identifies technologies, and reveals linked domains – useful for web-based threats.
- IPinfo: Provides IP geolocation, ASN, and network provider details for contextual awareness.
- ProxyCheck.io: Detects potential anonymization services (proxy, VPN, Tor) used by an IP.
- Internet Storm Center (ISC): Queries DShield API for IP/domain reputation scores.
- InternetDB (Shodan): Offers quick summaries of IP info, open ports, and vulnerabilities.
- Spur.us: Provides contextual risk scoring for IPs, domains, and emails.
- WildFire: Retrieves dynamic analysis results from Palo Alto Networks’ sandbox for malware behavior insights.
- Brave Search: Uses Brave Search API for broad open-source intelligence (OSINT) gathering.
- GitHub: Searches for related code, tools, or adversary TTP discussions on GitHub.
- …(Plus potentially others like Censys, Nmap, or custom internal tools)
Note: I will keep adding analyzers; check the project repository for updates. Some analyzers need an API key.
Interpreting the Results
Huntsman presents threat intelligence in four unique ways, offering valuable insights into the information. These views assist analysts in examining threats in the most effective manner, helping to grasp the situation clearly. To fully appreciate Huntsman’s capabilities, it’s essential to understand what each of these four views reveals.
1) Graph View (STIX Graph): Visually represents the relationships between submitted observables and related entities as interconnected STIX objects.

2) Table View (Report/Aggregated Results): Presents detailed findings from individual threat intelligence sources (analyzers) in a structured table format. Columns typically include Analyzer, Result, and Observable.
3) AI Insights: Offers a quick understanding of gathered information and related threats identified through keyword searches in Google News.

4) Detection: Appears if submitted or discovered observables match predefined Detection Rules configured in the “Rules” section. These act as alerts for specific indicators or patterns.

Huntsman Installation Guide
To begin using Huntsman, you will first need to ensure that Windows Subsystem for Linux (WSL) is activated on your system. This compatibility layer allows you to run a Linux environment directly on Windows, which is a prerequisite for Docker.
Next, proceed to install Docker Desktop from the official Docker website: https://www.docker.com/products/docker-desktop/. Docker Desktop provides the necessary tools and environment to build, run, and manage Docker containers, which Huntsman utilizes. Follow the installation instructions provided on the Docker website for your specific operating system.
Once Docker Desktop is successfully installed, open your command prompt or terminal and navigate to the directory where you would like to store the Huntsman project files. Execute the following command to clone the Huntsman repository from GitHub:
git clone https://github.com/aj-tap/huntsman
This command will download all the necessary Huntsman files and directories to your local machine. After the cloning process is complete, navigate into the newly created `huntsman` directory using the `cd` command:
cd huntsman
Inside the `huntsman` directory, you will find a `docker-compose.yml` file. This file defines the various services and configurations required to run Huntsman.
Create a .env file in the main huntsman directory/ Copy .env_sample to .env, then edit .env with your actual API keys, replacing the placeholders (e.g., VIRUSTOTAL_API_KEY=YOUR_VIRUSTOTAL_API_KEY). Save the file.
To start all the Huntsman services, execute the following command:
docker-compose up --build
This command will instruct Docker Compose to build and start the containers defined in the `docker-compose.yml` file. You may see various logs and outputs as the containers are being set up. Allow some time for all the services to start completely.
Once all the containers are running, you can access the Huntsman web interface by opening your web browser and navigating to the following address:
127.0.0.1:8000
This will open the Huntsman application in your browser, allowing you to begin utilizing its threat intelligence capabilities.
Conclusion
Huntsman is an open-source tool designed to help security teams manage and analyze threat intelligence data more effectively. It centralizes information from multiple sources, allows for custom detection rules using a query language, and employs a scalable backend for processing. This helps to reduce the time and effort required to investigate potential threats and enables proactive threat hunting. Ultimately, Huntsman aims to empower security teams by providing a single, comprehensive platform for threat intelligence.
Support the project at https://github.com/aj-tap/huntsman, and feel free to send suggestions.


Leave a comment