Author: Aj-Tap

Table of contents
Introduction
Analyzing logs is crucial for understanding security incidents. Logs record activities or events within a system. Defenders frequently work with raw logs from diverse sources. Situations arise where raw log analysis is necessary without a SIEM. While Excel is a traditional tool, it has limitations, particularly with large log files (e.g., exceeding 20MB) that can cause crashes. Moreover, various log types such as application, security, audit, server, system, and network exist in different formats (CSV, JSON, XML, syslog). Having various log formats can really slow down defenders. They end up spending more time just getting the data ready instead of actually looking for threats.
Logtap is a web application designed to overcome the difficulties of log analysis. Inspired by Brimdata’s zui (as discussed in a previous article), Logtap differs by being built with Go, compiled to WASM and JavaScript. This unique approach eliminates the need for environment setup, as Logtap runs directly in the browser, utilizing local resources and keeping data private. While WASM introduces some performance differences compared to native applications, its advantages are significant, especially in restrictive SOC environments where installing additional software is prohibited. A browser-based tool like Logtap overcomes this limitation.
Key Capabilities
On-the-Fly Data Shaping and Preparation
Before analysis can begin, log data is often messy and inconsistent. LogTap solves this with its Shaper Scripts feature, which uses pre-built SuperSQL queries in simple YAML files. With one click, you can apply a shaper to clean up your raw data. This includes parsing unstructured syslog, renaming inconsistent field names, or flattening nested JSON from EVTX files. These scripts standardize your data, making it clean and ready for better querying and scanning.
A Powerful, In-Browser Scanning Engine
The scanning feature in Logtap enables thorough examination of log data using SuperSQL queries and regular expressions. I’ve developed a Command-Line Interface (CLI) version of this tool, named Musashi, which offers native performance. If you’re interested, I encourage you to explore it further.
Users can create custom SuperSQL queries using regex patterns to find specific events in their logs. It works similarly to tools like Hayabusa or Chainsaw but entirely in the browser. The process begins by loading detection rules, including a library based on the popular Sigma rules converted to SuperSQL syntax. When a scan starts, a background worker executes each rule’s query against all data without freezing the user interface. Each Sigma rule is a SuperSQL query designed to identify patterns of suspicious activity. If a query matches, the scanner flags it and shows the relevant log entries, enabling quick investigation of potential threats directly from the raw data.
How it Works:
The workflow is designed to be simple and efficient, moving from broad detection to focused analysis in just a few clicks.
- Load Your Rules: The detection logic is driven by simple YAML files, where each rule consists of a name and a corresponding SuperSQL query. You can start immediately with the built-in library of rules or upload your own custom sets to hunt for specific patterns relevant to your investigation.
- Execute the Scan: With your data loaded and rules selected, a single click on “Run Scanner” kicks off the process. The background worker iterates through every rule, running its query against your data.
- Triage and Pivot: Matching log entries from a successful rule shows as “hits” in the results panel. From here, you have two powerful options to continue your analysis:
- Investigate: Instantly loads the rule’s query into the main query editor and runs it, allowing you to see the raw results in the context of the full dataset.
- Pivot: This is where you can truly slice down your data. Clicking “Pivot” takes the results from a specific hit and moves them into a brand-new, clean tab. This allows you to focus solely on the interesting events and continue your analysis without the noise of the original log file.
Event Frequency and Timeline Analysis
The timeline feature provides a way to visualize event frequency over time, which is useful for identifying unusual spikes or trends in activity. After a query produces results in the main table, the user can enable the timeline view. The interface requires selecting a timestamp field from the data and defining a time interval for bucketing (e.g., ‘1h’, ’10m’). When generated, the tool runs a new SuperSQL query in the background against the original dataset, aggregating the total count of events within each interval. The results are then plotted on an interactive line chart. A key feature is the chart’s zoom capability; zooming into a specific time range on the chart will automatically update the main search query box with that new time window, allowing you to instantly filter the main results to the specific logs that make up a spike or area of interest.
Visualizing Lateral Movement
The visualization feature turns query results into a graph that shows relationships between log entries. It helps track lateral movement by mapping security events. Below is an example of a visual graph from a security event log.
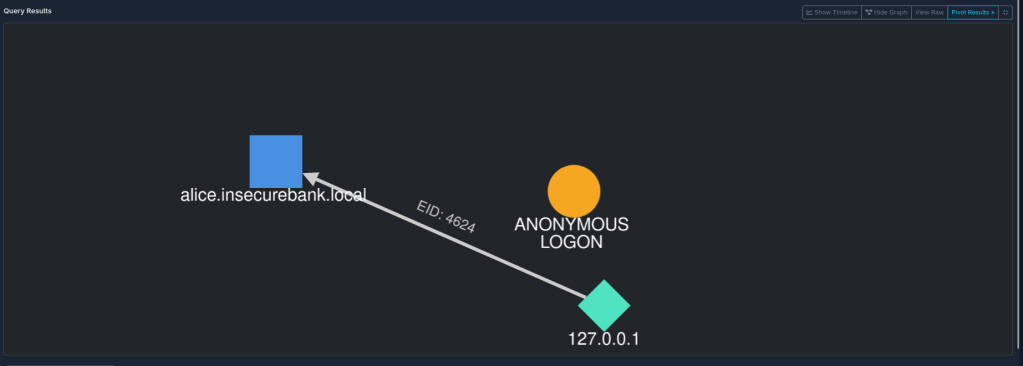
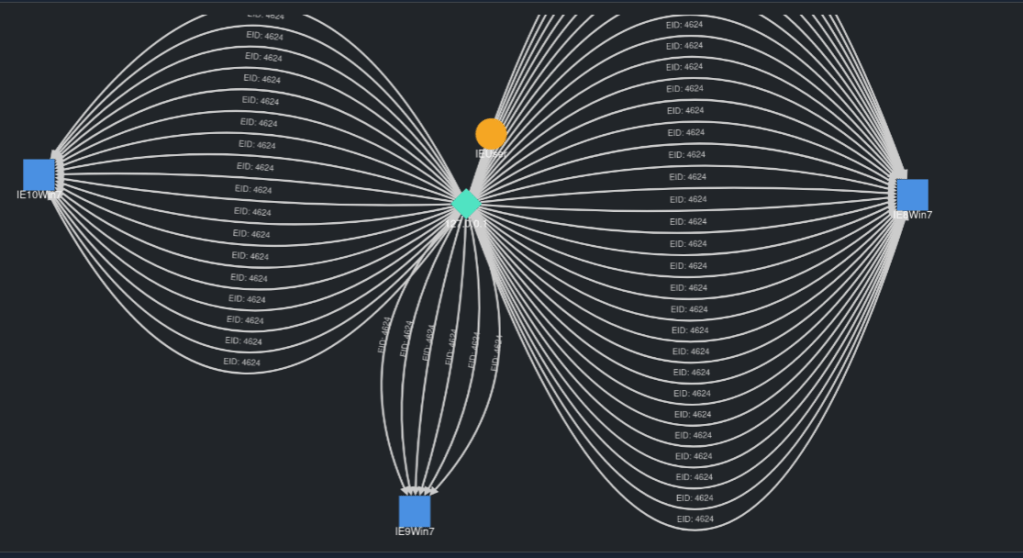
By clicking the “Visualize” button, LogTap’s graphing engine, powered by Cytoscape.js, processes security events. It highlights key entities like IP addresses, hostnames, and user accounts as nodes on the graph. Connections between them, such as successful logins or failed attempts, appear as clear, color-coded edges, offering a simple visual of possible attacker activity and enabling pattern analysis.
Conclusion
LogTap provides a functional, browser-based solution for log analysis, integrating shaping, scanning, and visualization into a single interface. By running entirely client-side, it allows for the analysis of sensitive log data without requiring it to be uploaded to a server. The ability to apply shaper scripts prepares data for analysis, the scanner uses rule-based queries to identify notable events, and the visualization engine helps in mapping out relationships within the data. While there are performance limitations inherent to a WebAssembly-based application, the tool offers a portable and alternative to native command-line utilities.
You can explore the project and its capabilities further by visiting the GitHub repository or trying the live demo.


Leave a reply to r3nzsec Cancel reply